2025 buyers are dreaming bigger—and it starts in the backyard.
See what’s trending 


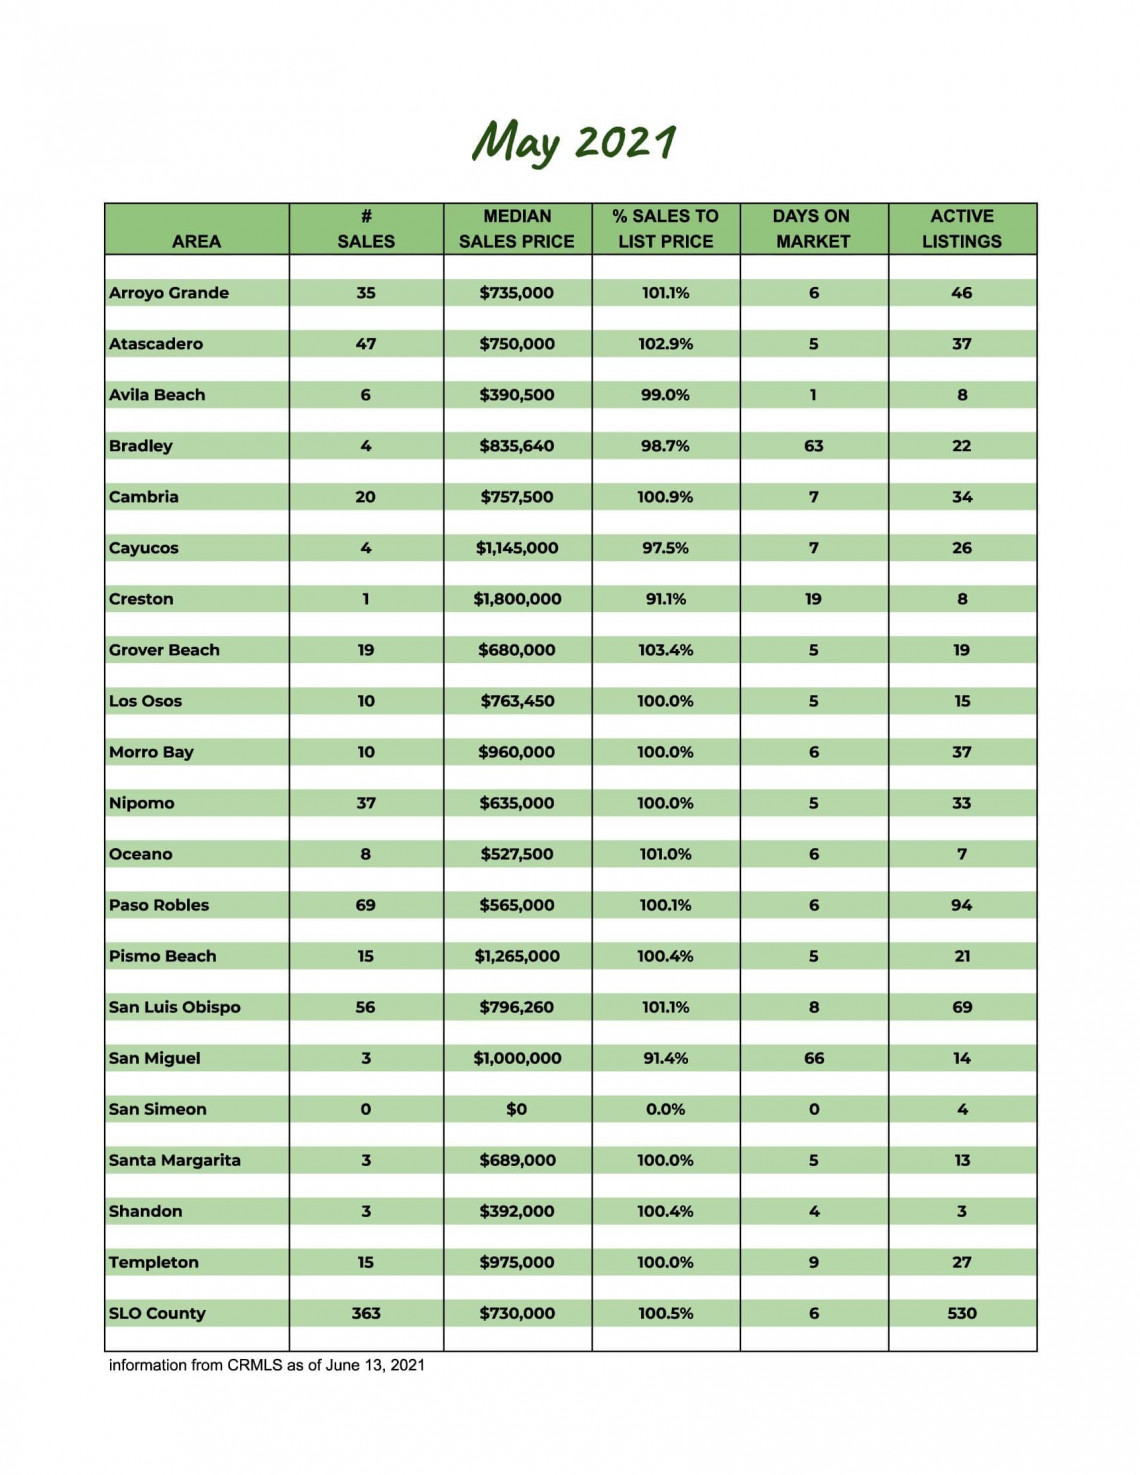
SAN LUIS OBISPO COUNTY MARKET UPDATE - MAY 2021
Real estate continues to make headlines, both nationally and locally. Here's a look at our local Central Coast market.
The data paints a true picture of the principles of supply and demand. Current supply of 530 active listings has been cut almost in half from last year's May inventory of 1,009 active listings. Demand remains strong as 363 sales this year is more than double last year's 170 sales.
The other half of that coin is the basic principles of cause and effect. The causes attributing to the low inventory vary, but low inventory is definitely causing the dramatic effect of a 22.1% increase in average sales prices from May last year to this year.
Inventory has seen a modest increase over the past two months, but with a median 6 days on the market and only 1.4 months of inventory, it remains a seller's market.
Scroll on down and take a look at San Luis Obispo County's average stats and a little further down for the median stats by community.
452
New Listings
530
Active Listings
352
Under Contract
363
Closed Sales
Homes Sold
101.8%
Sale-to-List Price

$825,797
Average Sales Price

1.4
Months of Supply

29
Average Days on Market

$459
Average Price per Square Foot