Thinking of selling this spring? Here's why your agent's tech skills matter.
Learn More 


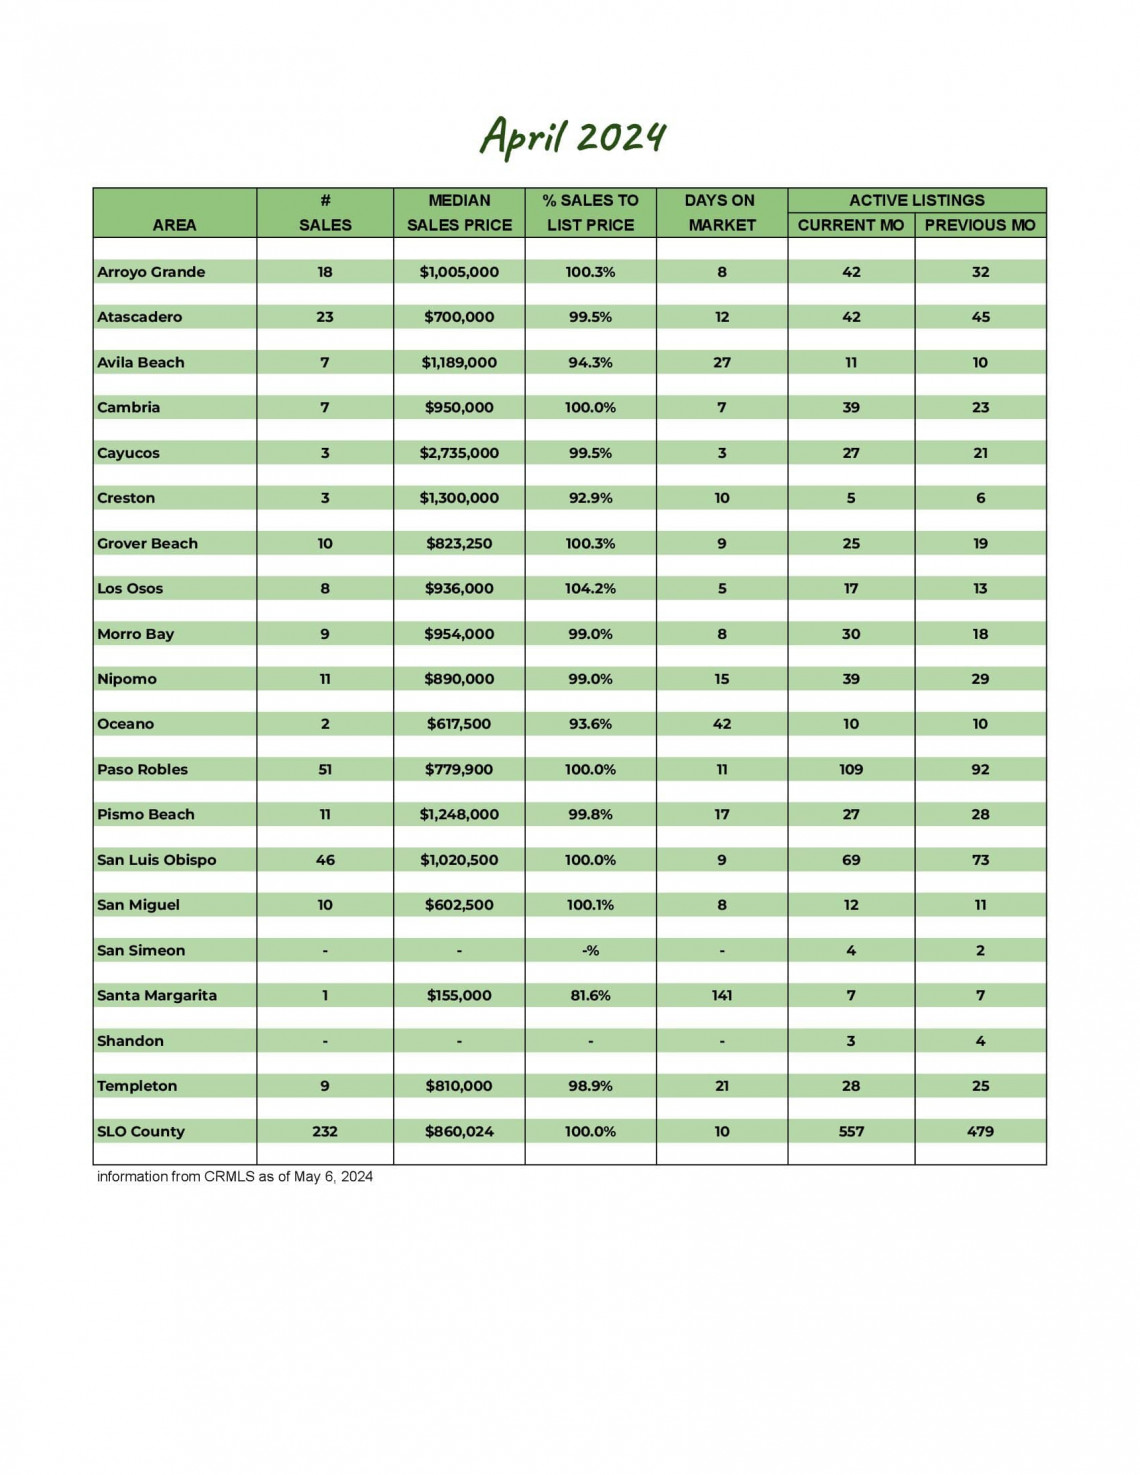
San Luis Obispo County April 2024 Market Update
Whether you're thinking of buying or selling a home, or just like to stay up to date on the real estate market, you need real data that is locally sourced to keep you informed.
Knowing the most important data such as the average sales price, number of homes sold, and days on market will better prepare you for your real estate transaction.
April 2024 saw a 31.1% increase in number of closed sales from last year. Pending sales were down 25.2% from last month and 33.3% from last year. Both new listings and current inventory saw small increases from last month as well as last year.
The average sales price is up 1.2% from last year, while the average price per square foot is up 10.7%. The average percentage of the sales price to list price rose to 98.0%, as 52.6% of the homes sold for the list price or above.
Our market report showcases everything you need to know about each San Luis Obispo County community's real estate trends.
283
New Listings
2023: 267
557
Active Listings
2023: 478
168
Under Contract
2023: 252
232
Closed Sales
2023: 177
Homes Sold
98.0%
Sale-to-List Price
2023: 98.6%

$997,564
Avg Sales Price
2023: $985,725

2.8
Months of Supply
2023: 2.2

36
Avg Days on Market
2023: 44

$571
Avg Price per Sq Foot
2023: $516