Preparing your home to sell? Here’s what not to remove
See the List 


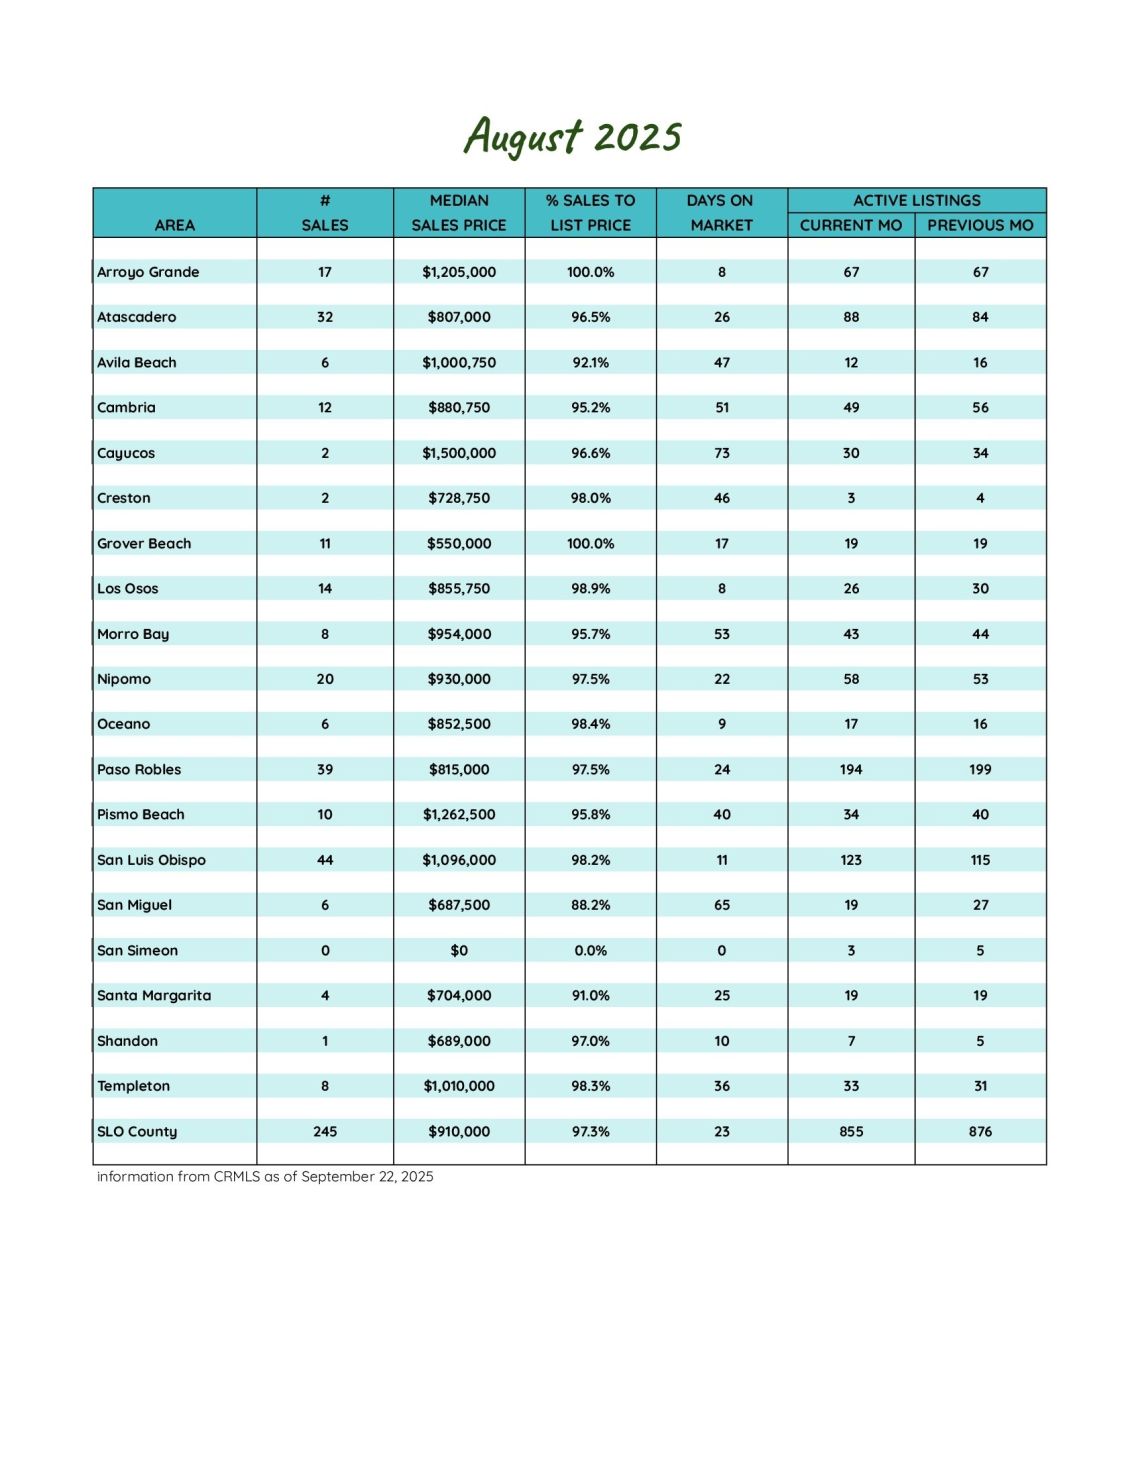
San Luis Obispo County August 2025 Market Update
Inventory Holds Steady as Buyer Activity Cools, Prices Edge Higher
As summer winds down, the San Luis Obispo County housing market is settling into a slower rhythm. August’s numbers reveal fewer new listings, a dip in buyer momentum, and slight pricing gains—evidence that buyers and sellers are adjusting to a more balanced playing field. While inventory remains elevated compared to last year, fewer homes are hitting the market, and sales activity continues to moderate.
Inventory Trends: Stable Supply, Fewer New Listings
New listings declined sharply in August—288 homes came on the market, down 11.1% from July’s 324 and 15.0% below August 2024’s 339. Active listings, meanwhile, held relatively steady at 855, just 1.5% lower than July’s 868 but 12.4% higher than a year ago. The flat month-over-month supply suggests that while sellers are pulling back, overall availability is still healthier than last summer.
Sales Activity: Pending Deals Slip, Closings Hold Firm
Buyer activity showed further cooling. Pending sales fell to 211, a 14.6% drop from July’s 247 and 13.5% below August 2024’s 244. Closed sales remained steadier—245 homes changed hands, down just 1.6% from July’s 249 and up slightly from 239 a year ago. About 34% of homes sold at or above their list price, and 32% went under contract within 10 days, indicating that well-priced, desirable properties are still moving quickly even as overall momentum slows.
Pricing and Market Pace: Edging Upward Amid Selective Buying
Despite cooler sales, prices inched higher. The average sales price rose to $1,068,749, up 4.6% from July and 1.2% year-over-year. Price per square foot climbed to $581, up 2.6% month-over-month and 2.5% from last August. The list-to-sale price ratio softened slightly to 95.8%, suggesting buyers are negotiating more than last year’s 97.3%. Days on market averaged 39, a touch faster than July’s 40 but slower than last year’s 38. Months of supply held at 4.0, up 11.1% year-over-year, signaling balanced conditions.
Luxury and Community Highlights
Luxury activity remained notable: six of the county’s nineteen communities posted median sale prices over $1,000,000, while four communities stayed under $750,000. There were eleven sales above $2,000,000, with a high-water mark of $7,500,000—evidence that the top end of the market is still active even as mid-tier buyers take more time.
What It Means for Buyers and Sellers
For sellers, competitively priced and well-presented homes are still attracting strong offers, but overpricing can quickly lead to longer market times. Buyers, meanwhile, benefit from more inventory and increased negotiating power compared to last summer, even as desirable homes continue to move swiftly. As we transition into fall, the market appears poised for a steady, measured pace—less frenzied than recent years but far from stagnant.
As always, if you have questions or are looking to make a move, feel free to reach out.
Stay tuned for next month’s update!
288
New Listings
2024: 339
855
Active Listings
2024: 761
211
Under Contract
2024: 244
245
Closed Sales
2024: 239
Homes Sold
95.8%
Sale-to-List Price
2024: 97.3%

$1,068,749
Avg Sales Price
2024: $1,055,613

4.0
Months of Supply
2024: 3.6

39
Avg Days on Market
2024: 38

$581
Avg Price per Sq Foot
2024: $567