2025 buyers are dreaming bigger—and it starts in the backyard.
See what’s trending 


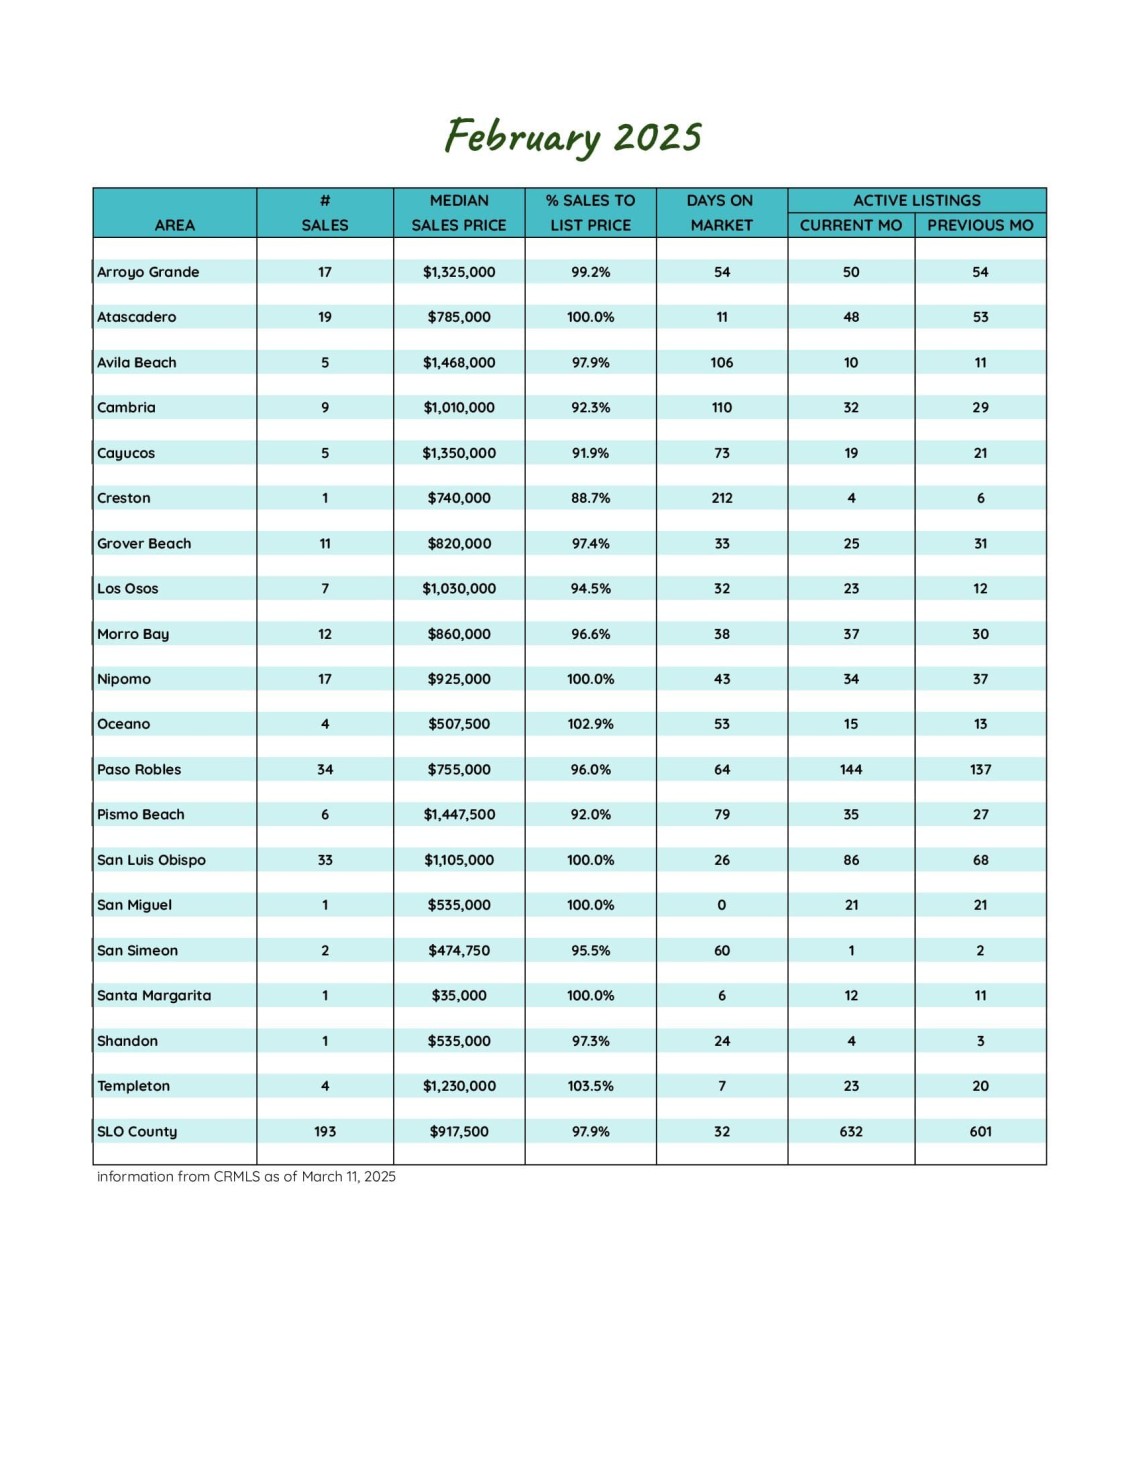
San Luis Obispo County February 2025 Market Update
Whether you're considering buying or selling a home or simply staying informed about the local real estate scene, having access to the latest data is crucial. Our San Luis Obispo County market report provides a comprehensive look at current trends, helping you make well-informed decisions.
As we head into the spring market, the February market activities saw some inconsistent bouncing around when compared to last year as well as last month. The number of new listings decreased 19.4% from the same period last year, and 14.8% from last month. Pending sales decreased 36.6% from the same period last year and 51.1% from last month. Current inventory ended the year 12.7% higher than last year as closed sales increased 2.7% from last year but 34.0% less than last month.
The average sales price in San Luis Obispo County has increased by over 4.2% compared to last year. February's average sales price was down less than 1.5% from last month. The average price per square foot is up 3.7% from last year. The average percentage of the sales price to list price ratio increased to 96.6% as 28% of the homes sold were above the listing price. The average days on the market jumped by 25.6% from last year yet 24% of the homes sold in less than ten days on the market.
Knowing the most important data such as the average sales price, number of homes sold, and days on market can significantly enhance your real estate strategy, whether you're buying or selling.
Our market report showcases everything you need to know about each San Luis Obispo County community's real estate trends.
225
New Listings
2024: 279
632
Active Listings
2024: 561
137
Under Contract
2024: 216
193
Closed Sales
2024: 188
Homes Sold
96.6%
Sale-to-List Price
2024: 96.9%

$1,041,360
Avg Sales Price
2024: $999,237

3.0
Months of Supply
2024: 2.7

54
Avg Days on Market
2024: 43

$589
Avg Price per Sq Foot
2024: $568