2025 buyers are dreaming bigger—and it starts in the backyard.
See what’s trending 


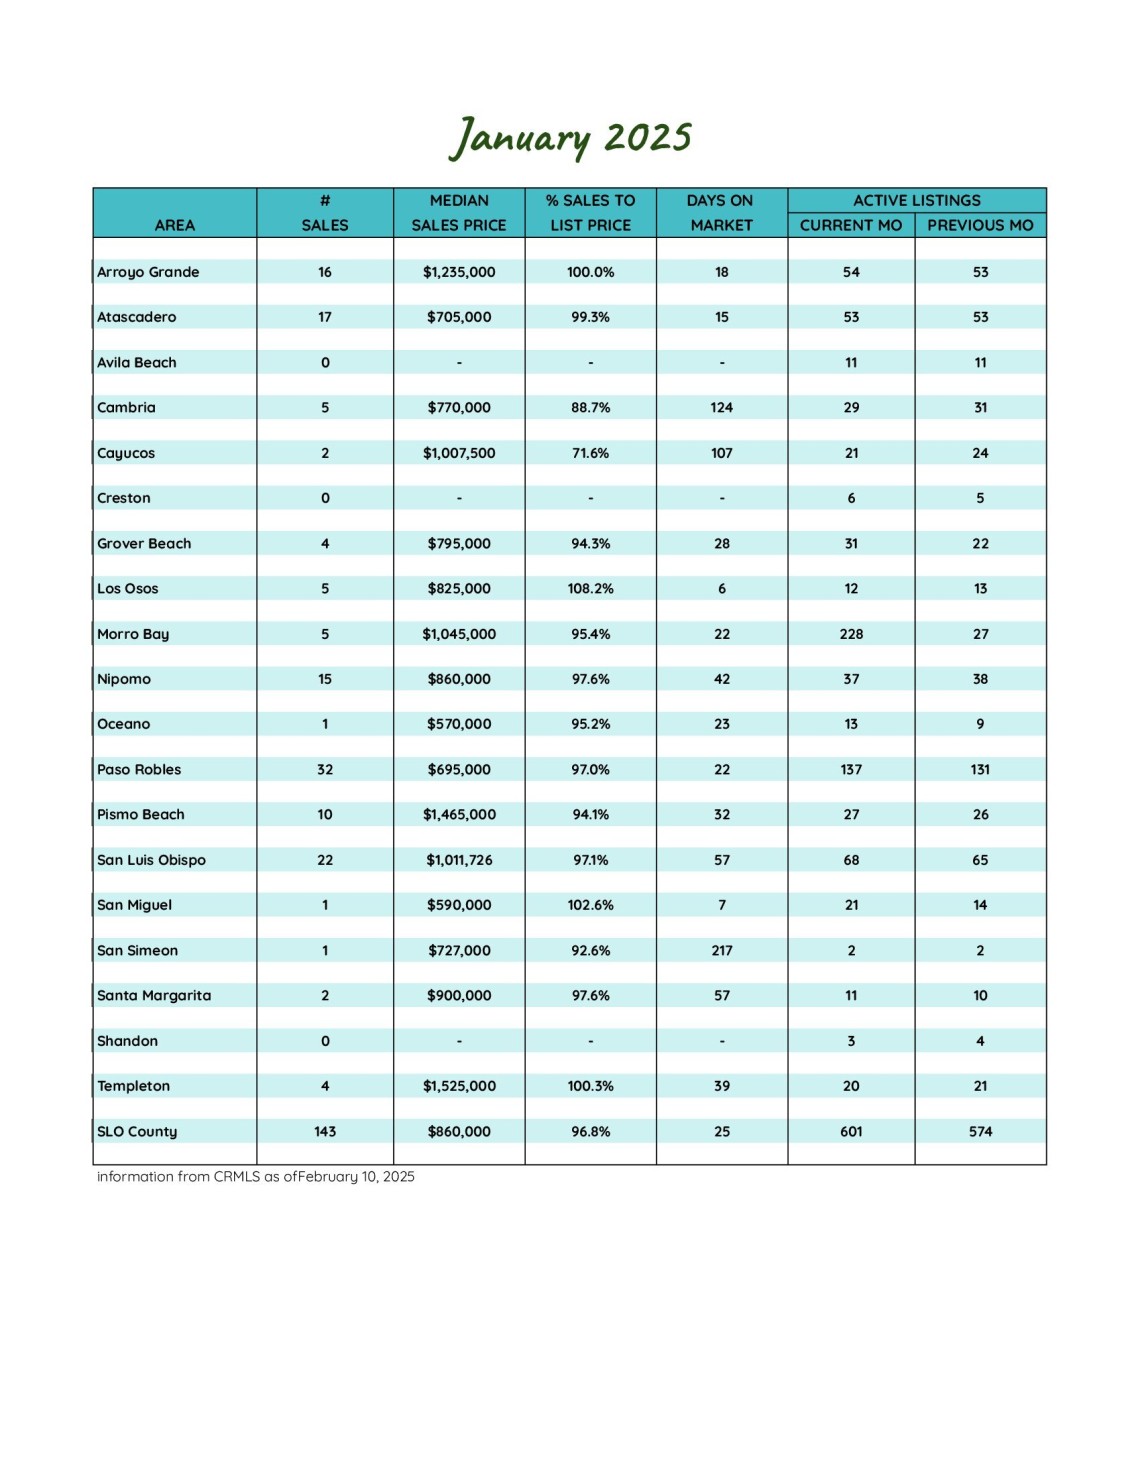
San Luis Obispo County January 2025 Market Update
Whether you're considering buying or selling a home or simply staying informed about the local real estate scene, having access to the latest data is crucial. Our San Luis Obispo County market report provides a comprehensive look at current trends, helping you make well-informed decisions.
As expected, most of January's market activities saw significant increases from December's seasonal lows. Comparisons to January 2024 activity saw some bouncing around. The number of new listings decreased 10.1% from the same period last year, and pending sales dipped 27.0% from the same period. Current inventory ended the year 13.6% higher than last year as closed sales dropped 14.9%.
The average sales price in San Luis Obispo County has increased by over 20% compared to last year's record low of $879,396, which was the lowest since September 2021. January's average sales price was down 3.6% from last month. The average price per square foot is up 3.0% from last month and 6.3% from last year. The average percentage of the sales price to list price dipped to 95.6% and the average days on the market jumped by 50%.
Knowing the most important data such as the average sales price, number of homes sold, and days on market can significantly enhance your real estate strategy, whether you're buying or selling.
Our market report showcases everything you need to know about each San Luis Obispo County community's real estate trends.
231
New Listings
2024: 257
601
Active Listings
2024: 529
154
Under Contract
2024: 211
143
Closed Sales
2024: 168
Homes Sold
95.6%
Sale-to-List Price
2025: 97.1%

$1,059,813
Avg Sales Price
2024: $879,396

2.8
Months of Supply
2024: 2.6

54
Avg Days on Market
2024: 36

$593
Avg Price per Sq Foot
2024: $558