Buying a home means choosing a lifestyle
Learn More 


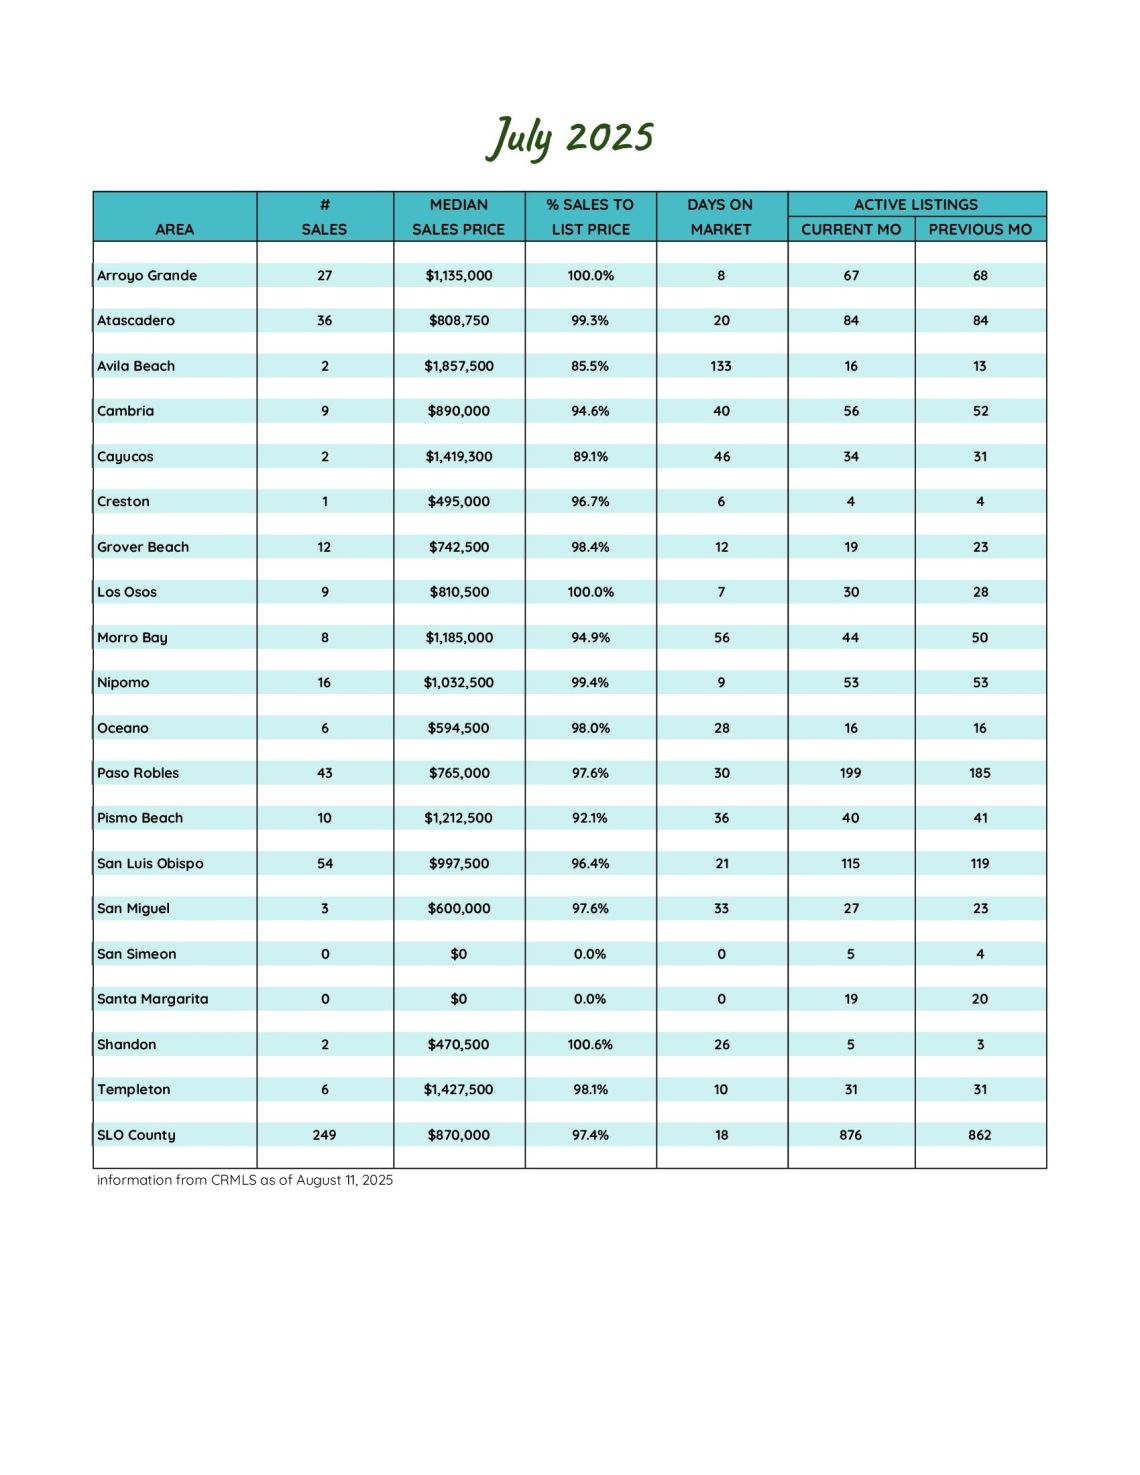
San Luis Obispo County July 2025 Market Update
Inventory Climbs, Sales Ease, and Pricing Shows Mixed Signals
July brought a blend of cooling momentum and shifting dynamics in the San Luis Obispo County housing market. Inventory continued its climb to multi-year highs, but both pending and closed sales slowed from last month, hinting that buyers may be taking a more measured approach in today’s environment.
Inventory Trends: Supply Edges Higher
Active listings in July reached 876, up 2.4% from June and an impressive 22.3% higher than July 2024. This marks one of the highest inventory levels since the pre-pandemic market, with nearly half of all active homes having at least one price reduction. Those reduced listings have been on the market an average of 93 days, compared to 59 days for pending homes with price cuts—evidence that motivated sellers are starting to meet the market.
New listings, however, told a different story—falling 8.7% from June and down 6.2% from a year ago. The pullback in fresh supply suggests that while more homes remain available, fewer sellers are jumping into the market mid-summer.
Sales Activity: A Step Back from June’s Pace
Pending sales fell sharply, down 21.8% from June and 18.8% from last July, signaling that buyer activity cooled notably as summer progressed. Closed sales also slowed—down 10.1% from June—although they matched last year’s July total exactly at 249.
The days-on-market average dropped slightly from June’s 43 to 40, but homes are still sitting 38% longer than this time last year. About 35% of homes sold in 10 days or less, underscoring the continued demand for well-priced, move-in-ready properties.
Home Prices and Affordability: Mixed Movement
After four straight months of decline, the average sales price inched up 1.4% from June to $1,023,683. Still, that’s nearly 9% lower than the July 2024 peak of $1,121,886. The price per square foot was largely unchanged from last month at $566 but sits 4.1% below last year’s number.
The list-to-sale price ratio dipped to 96.0%, continuing a gradual softening in negotiation strength for sellers. Just 37% of July sales closed at or above asking price, reflecting a more balanced playing field for buyers.
Market Segmentation: From Entry-Level to Luxury
San Luis Obispo County’s diverse price points remain in full view. Seven of the nineteen tracked communities posted median sale prices above $1,000,000, while six came in under $800,000.
Luxury activity remained healthy, with 15 sales topping $2 million—including a high of $3.9 million—showing that demand for unique, high-end properties hasn’t disappeared, even as broader market momentum moderates.
Looking Ahead: A Balancing Act Continues
The local housing market is still in a period of recalibration. Buyers are gaining more time and options, while sellers face the reality of increased competition and a need to price strategically. With mortgage rates and economic indicators still in flux, expect this balancing act to continue into the fall.
For now, the opportunities are there—whether you’re a buyer looking for leverage or a seller aiming to stand out in a crowded field.
As always, if you have questions or are looking to make a move, feel free to reach out.
Stay tuned for next month’s update!
304
New Listings
2024: 324
876
Active Listings
2024: 716
186
Under Contract
2024: 229
249
Closed Sales
2024: 249
Homes Sold
96.0%
Sale-to-List Price
2024: 97.9%

$1,023,683
Avg Sales Price
2024: $1,121,886

4.1
Months of Supply
2024: 3.4

40
Avg Days on Market
2024: 29

$566
Avg Price per Sq Foot
2024: $590