2025 buyers are dreaming bigger—and it starts in the backyard.
See what’s trending 


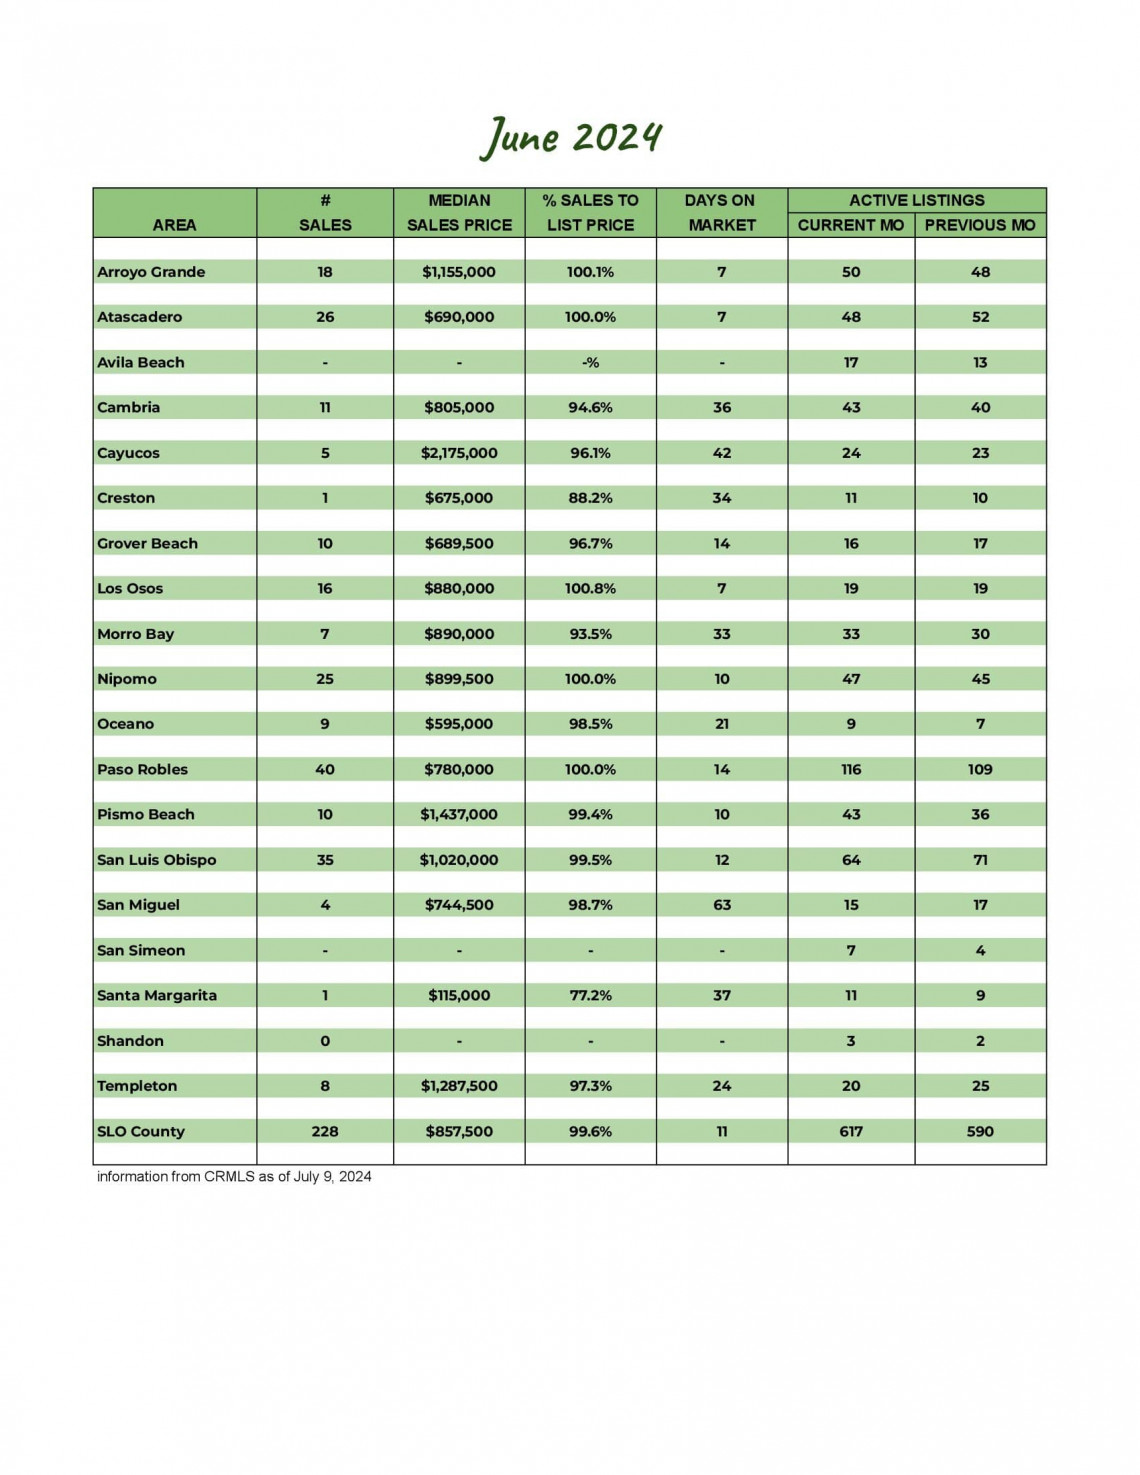
San Luis Obispo County June 2024 Market Update
Whether you're thinking of buying or selling a home, or just like to stay up to date on the real estate market, you need real data that is locally sourced to keep you informed.
Current inventory remains less than half of the pre-pandemic levels even with a 19.3% increase in active listings from last year. The number of new listings in June is down 22.3% from May and 8.8% from June of last year. Pending sales also saw drops, 28.4% from last month and 26.6% from last year. Closed sales were virtually the same as last month as well as last year.
The average sales price is up 1.2% from last year, while the average price per square foot is up 2.0%. The average percentage of the sales price to list price is up to 99.1%%, while just less than half of the homes sold for the list price or above with an average of 13 days on the market.
Knowing the most important data such as the average sales price, number of homes sold, and days on market will better prepare you for your real estate transaction.
Our market report showcases everything you need to know about each San Luis Obispo County community's real estate trends.
258
New Listings
2023: 283
617
Active Listings
2023: 517
179
Under Contract
2023: 244
228
Closed Sales
2023: 230
Homes Sold
99.1%
Sale-to-List Price
2023: 100.3%

$1,015,062
Avg Sales Price
2023: $1,003,497

3.0
Months of Supply
2023: 2.5

33
Avg Days on Market
2023: 30

$565
Avg Price per Sq Foot
2023: $554