What your home style might say about you (even if you’ve never thought about it)
Read the Post 


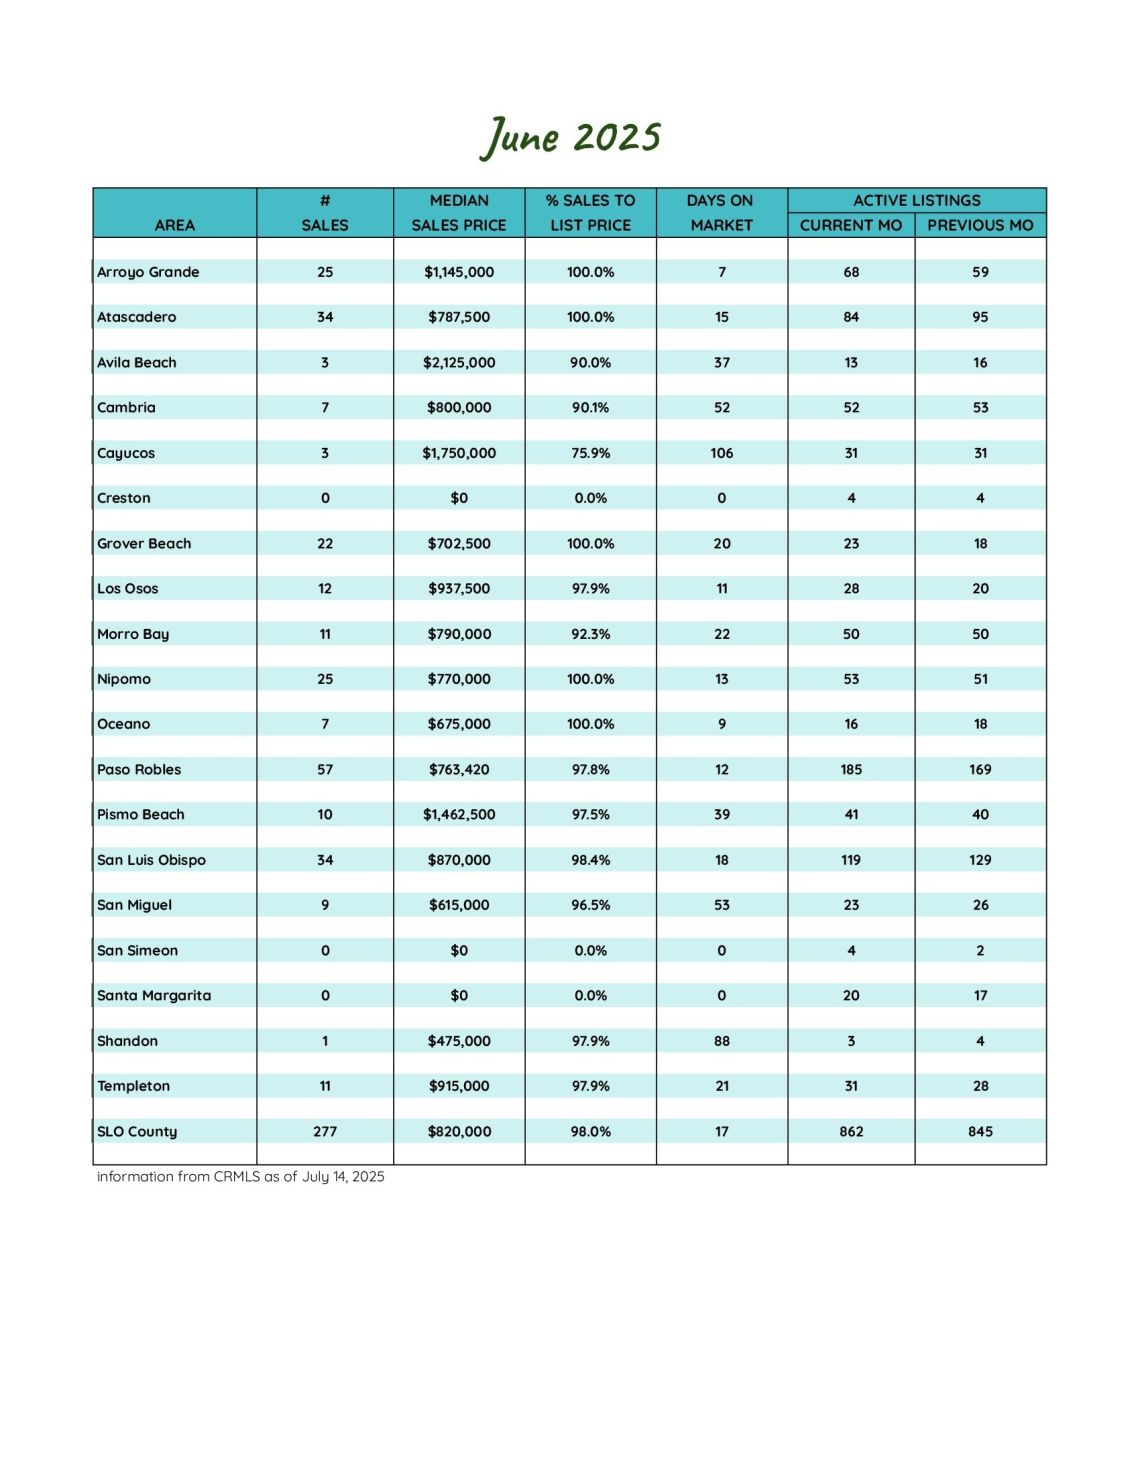
San Luis Obispo County June 2025 Market Update
Listings Rise, Prices Ease, and Inventory Hits Five-Year Highs
As we settle into the heart of summer, the San Luis Obispo County housing market is showing signs of transition—marked by growing inventory, fluctuating sales activity, and subtle shifts in pricing. June’s numbers delivered a blend of contrasts: year-over-year growth in some areas, softening in others, and a continued recalibration between buyers and sellers.
Inventory Trends: Supply Expands to Multi-Year Highs
June brought a surge in inventory, marking a notable milestone for the county. Active listings rose 3.9% from May and are now 29.6% higher than they were this time last year. That makes current inventory levels the highest we've seen since August 2020, when the pandemic market inventory was tightening.
Much of this growth is concentrated in key markets: Morro Bay, Cambria, Atascadero, Paso Robles, and San Luis Obispo all saw inventory climb to five-year peaks, signaling a meaningful shift in seller activity and longer market times. However, despite this jump, new listings in June fell 6.8% from the previous month—an ongoing reminder that sellers are still hesitant. Compared to the bustling days of mid-2022, new listing activity continues to lag behind July 2022 levels.
Sales Activity: Momentum Slows Amid More Choices
While inventory expands, buyer activity appears more selective. Pending sales dropped sharply—down 11.3% year-over-year and a striking 31% from May. This slowdown may reflect a combination of buyer caution and increased time to consider a growing list of available homes.
Interestingly, closed sales told a different story, rising 21.1% compared to June 2024 and jumping 32.0% from last month. This may point to a backlog of earlier deals finally closing or increased urgency ahead of summer travel and rate uncertainty.
Home Prices and Affordability: A subtle Softening
The pricing picture in June revealed a slight cooling in the market. The average sales price declined 0.6% year-over-year and dropped 2.3% from May. Similarly, the average price per square foot dipped a modest 0.2% compared to last June.
The average list-to-sale price ratio slid to 96.8%, showing some negotiation room has returned to the market. Still, 38% of homes sold above asking, suggesting that well-priced homes in desirable areas are still generating competitive offers.
One interesting contrast: 36% of homes sold in under 10 days, while the overall average days on market climbed 30.3% compared to a year ago. This duality highlights a growing divide—fast-moving sales for standout properties, and longer waits for homes that miss the mark on price or presentation.
Luxury & Market Segmentation: A Tale of Two Markets
Luxury activity remained vibrant in June, with 16 homes selling for over $2 million, including another impressive transaction in Avila Beach topping $6.1 million. High-end coastal homes continue to attract demand, even as broader market momentum softens.
Across the county, four communities now have a median price point over $1,000,000, while three remain under $675,000—illustrating the wide price diversity across San Luis Obispo County. From wine country estates to coastal bungalows, the local market remains segmented by lifestyle and budget.
Looking Ahead: What to Watch
The San Luis Obispo market is shifting—but not collapsing. Sellers face more competition than they have in years, while buyers are gaining time and leverage. As mortgage rates remain in flux and affordability remains a top concern, expect continued recalibration throughout the summer.
Whether you're thinking of entering the market or just watching from the sidelines, staying up to date on these trends is essential. With more inventory and slightly easing prices, the second half of 2025 may offer new opportunities for patient and prepared buyers.
As always, if you have questions or are looking to make a move, feel free to reach out.
Stay tuned for next month’s update!
322
New Listings
2024: 291
862
Active Listings
2024: 665
197
Under Contract
2024: 222
277
Closed Sales
2024: 229
Homes Sold
96.8%
Sale-to-List Price
2024: 97.0%

$1,009,439
Avg Sales Price
2024: $1,015,717

4.0
Months of Supply
2024: 3.2

43
Avg Days on Market
2024: 33

$565
Avg Price per Sq Foot
2024: $566