House hunting burnout? Here’s how to stay focused.
Read the tips 


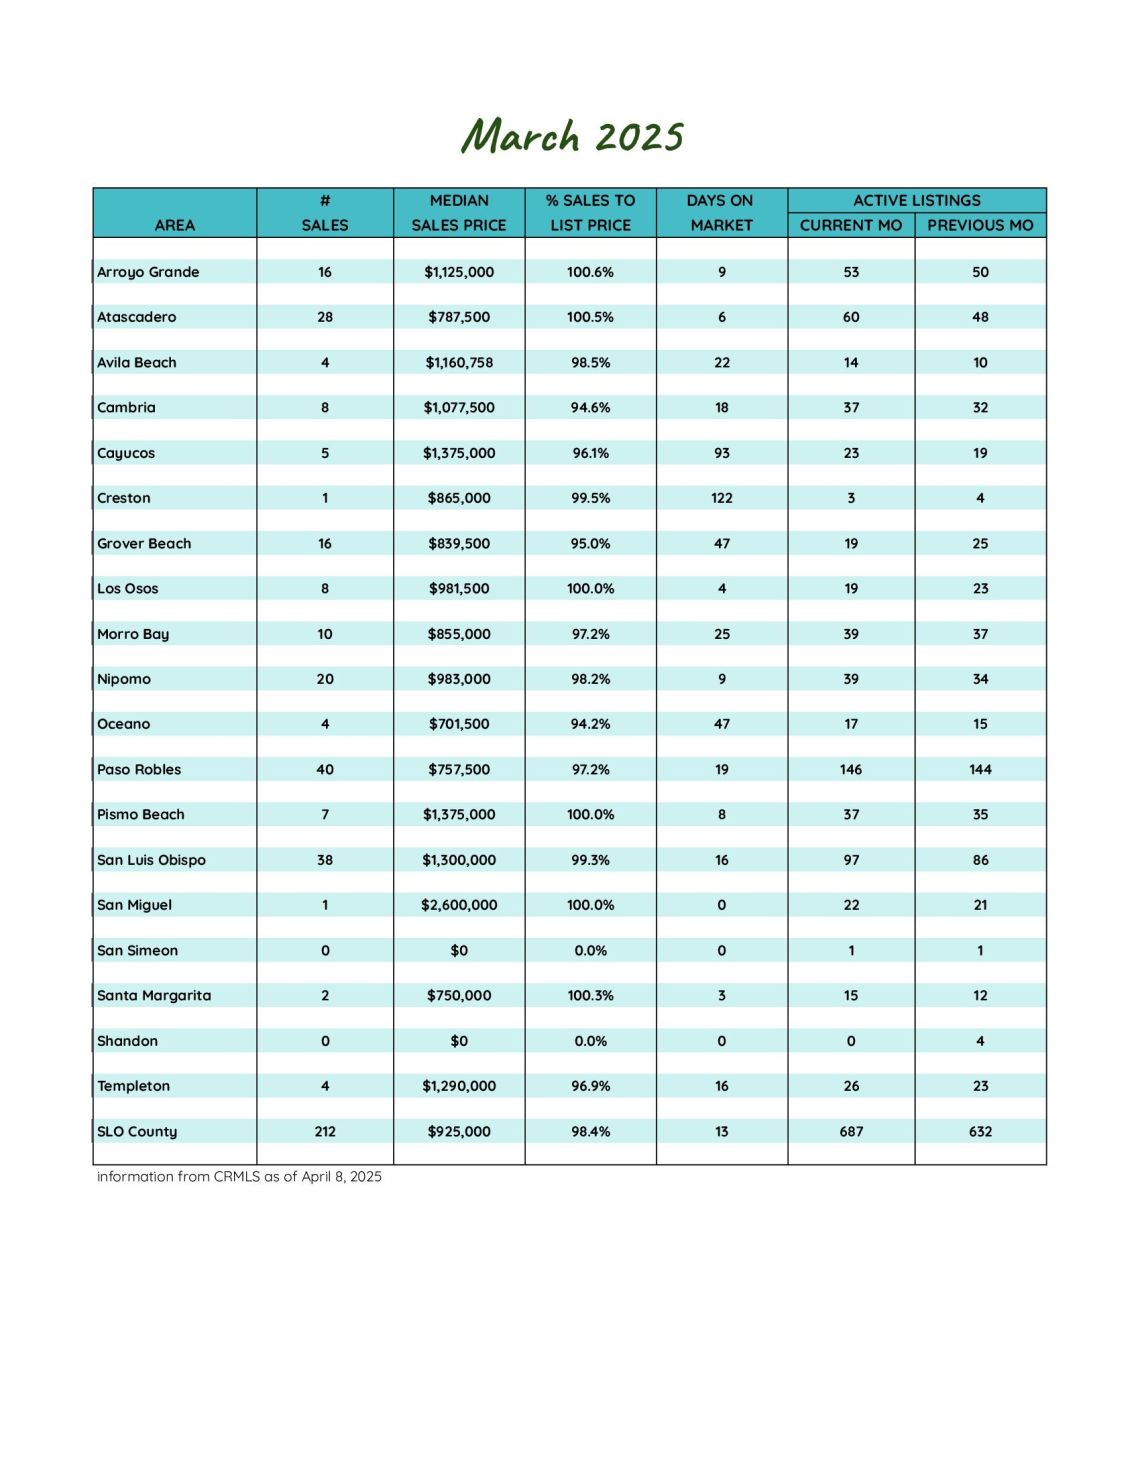
San Luis Obispo County March 2025 Market Update
Whether you're considering buying or selling a home or simply staying informed about the local real estate scene, having access to the latest data is crucial. Our San Luis Obispo County market report provides a comprehensive look at current trends, helping you make well-informed decisions.
As we tiptoed into the spring market, March seemed a bit unsure of itself—like it was still warming up for the main event. The real estate scene was a mixed bag, with activity that could best be described as "consistently inconsistent" compared to both last year and just last month. On the bright side, more sellers decided it was time to jump in, giving us an 8.8% increase in new listings compared to March 2024, and a 10% bump from February. That fresh inventory was a welcome sight!
Buyers, however, seemed a little more cautious. Pending sales were down 18.8% year-over-year, though there was a bit of positive momentum with an 8.3% increase from last month. Inventory continued to build, rising 21% over last year and nudging up 5.2% from February—a trend that could offer buyers a bit more breathing room this spring. Closed sales dipped 4.9% from last year, but picked up steam from February with a 9.8% increase.
Now let’s talk prices—because that’s what keeps things interesting. The average sales price in San Luis Obispo County jumped 10.5% from last year, and climbed 2.9% just since last month. The price per square foot is up 6.6% year-over-year, and homes are holding strong in value. In fact, 42.5% of homes sold at or above asking price, with sellers receiving an average of 97.7% of their list price. And while the average days on market was the same as this time last year, it dropped by 11 days compared to February. Nearly 44% of homes sold in less than 10 days—a hint that buyers are moving faster.
All in all, March was a month of mixed signals—but the increase in pricing and quicker sales pace suggest that demand is still there. With more inventory and warmer weather on the way, it will be interesting to see if April brings a bit more clarity to this season’s story.
Knowing the most important data such as the average sales price, number of homes sold, and days on market can significantly enhance your real estate strategy, whether you're buying or selling.
Our market report showcases everything you need to know about each San Luis Obispo County community's real estate trends.
285
New Listings
2024: 262
687
Active Listings
2024: 568
182
Under Contract
2024: 224
212
Closed Sales
2024: 223
Homes Sold
97.7%
Sale-to-List Price
2024: 97.5%

$1,071,776
Avg Sales Price
2024: $970,046

3.3
Months of Supply
2024: 2.7

43
Avg Days on Market
2024: 43

$595
Avg Price per Sq Foot
2024: $558