Should you stay or go? These 3 questions can help.
Read more 


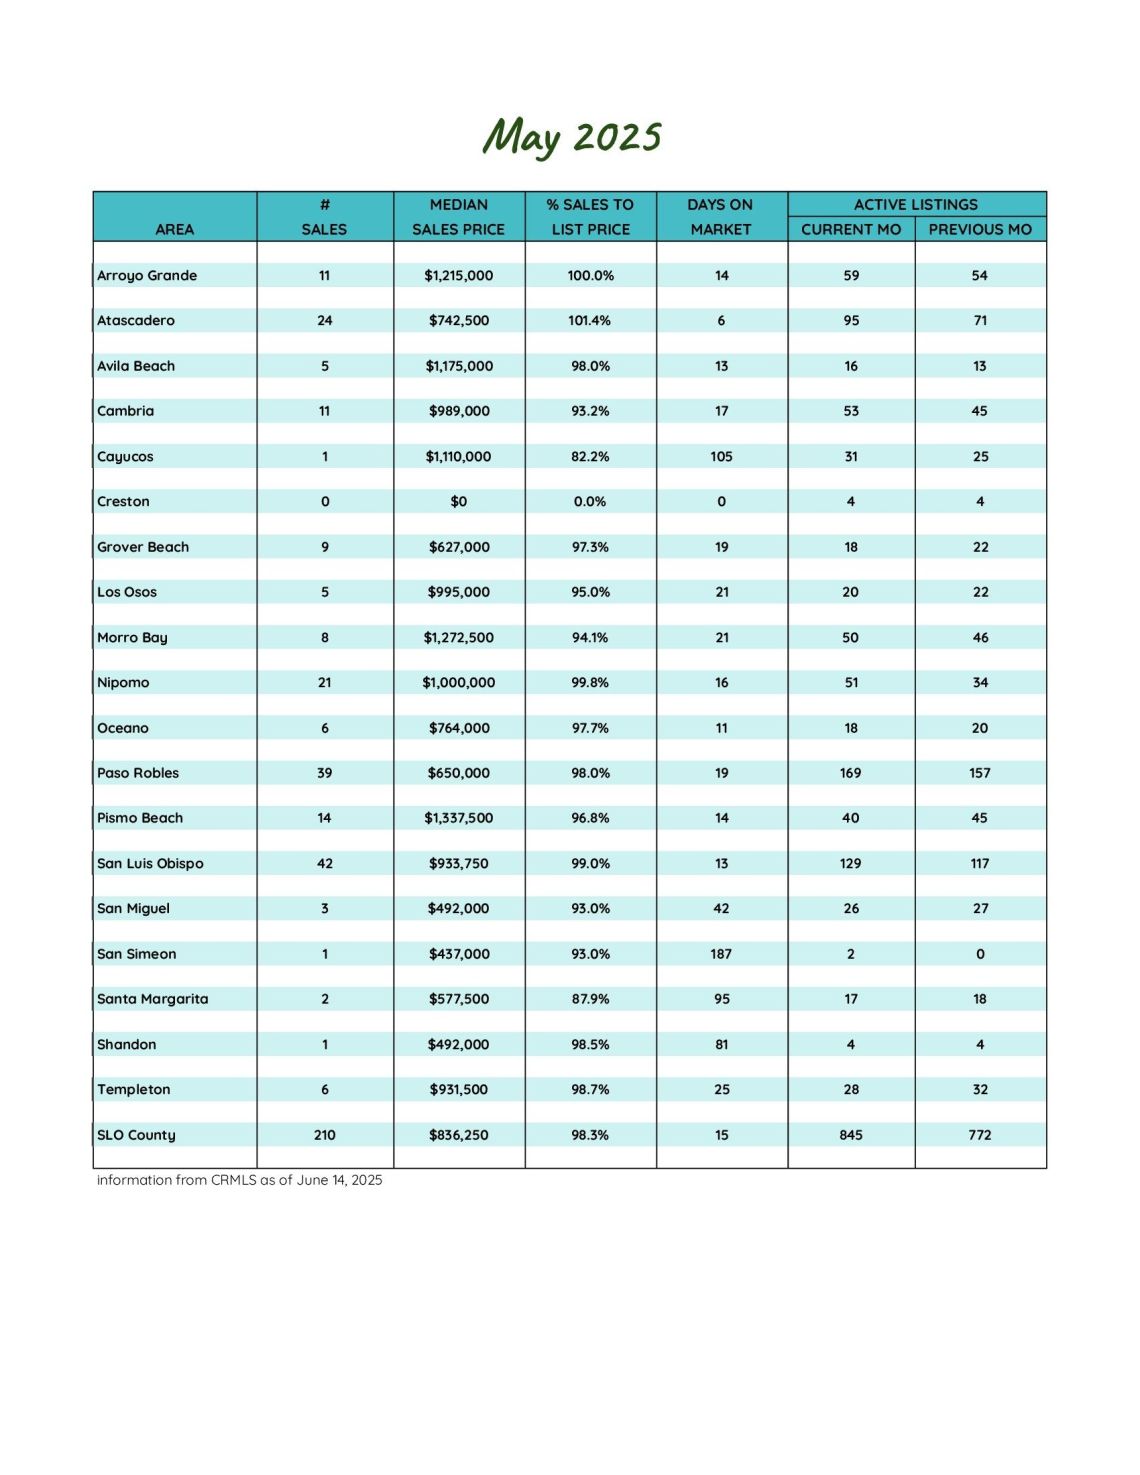
San Luis Obispo County May 2025 Market Update
Spring Inventory Builds, Sales Slow, and Buyers Gain Breathing Room
As we move through the final stretch of the spring real estate season, the San Luis Obispo County market continues to shift and recalibrate. May brought a mix of trends—some expected, some surprising—highlighting the ongoing balancing act between inventory growth, buyer caution, and seller expectations.
Inventory Trends: Supply on the Rise
One of the most notable shifts this month is the continued build-up in available homes. Active inventory rose 6.2% from April and is now nearly 30% higher than it was this time last year. Despite fewer new listings hitting the market—down 5.1% from last month and 4.4% year-over-year—the accumulation of unsold homes has pushed the months of supply to 4.0. That’s a milestone we haven’t seen since September 2019, and it signals a market slowly moving toward balance.
In particular, San Luis Obispo, Morro Bay, and Atascadero are leading the charge in inventory expansion, with each city nearly doubling its active listings since January.
Sales Activity: Slowing Momentum
While inventory is growing, sales activity is decelerating. Pending sales dropped 9.2% month-over-month and are down a substantial 21.6% compared to May 2024. Closed sales also declined, falling 6.7% from last month and 8.7% year-over-year.
However, one surprising twist: homes that are selling are moving faster. The average days on market dropped 27.7% from April and 17.1% from last year. Nearly 4 in 10 homes (38%) sold within 10 days—many for full price or more—showing that well-priced and well-presented homes still command strong interest.
Pricing and Affordability: Slight Dip, Steady Strength
Price trends offered a mixed message. The average sales price dipped 2.7% from last month but remains 3.8% higher than it was a year ago. Meanwhile, the price per square foot also slipped slightly by 1.5% this month, yet it's still up 5.6% annually. The list-to-sale price ratio remains solid, holding steady from last year and improving by 1% over the prior month—suggesting sellers are still achieving near-list expectations, if not exceeding them.
What does this mean for affordability? It depends where you're looking. Six communities in the county posted median sale prices above $1 million, while six others came in under $650,000. The market continues to reflect wide price diversity across the region.
Noteworthy Sales and Luxury Market
Luxury activity remains active, with ten homes selling for over $2 million in May. The top sale? A stunning property in Avila Beach that closed at $6,477,500, underscoring ongoing demand in premium coastal enclaves.
The Broader Economic Picture
Nationally, mortgage rates remain volatile but are trending slightly downward, bringing some relief to buyers. However, affordability challenges remain as wage growth continues to lag behind home prices in many markets—including ours. The increase in local supply may offer more choice and negotiating power, but economic uncertainty is clearly tempering buyer urgency.
If you're considering buying or selling in the SLO County area, staying informed about these trends is essential. As always, feel free to reach out to discuss the latest market conditions and how they may affect your real estate goals.
Stay tuned for next month's update, and don’t hesitate to reach out if you have any questions or are ready to make your next move!
329
New Listings
2024: 344
845
Active Listings
2024: 651
207
Under Contract
2024: 264
210
Closed Sales
2024: 230
Homes Sold
97.8%
Sale-to-List Price
2024: 97.8%

$1,032,638
Avg Sales Price
2024: $995,199

4.0
Months of Supply
2024: 3.1

34
Avg Days on Market
2024: 41

$601
Avg Price per Sq Foot
2024: $569