San Luis Obispo County Market Report
May 2022
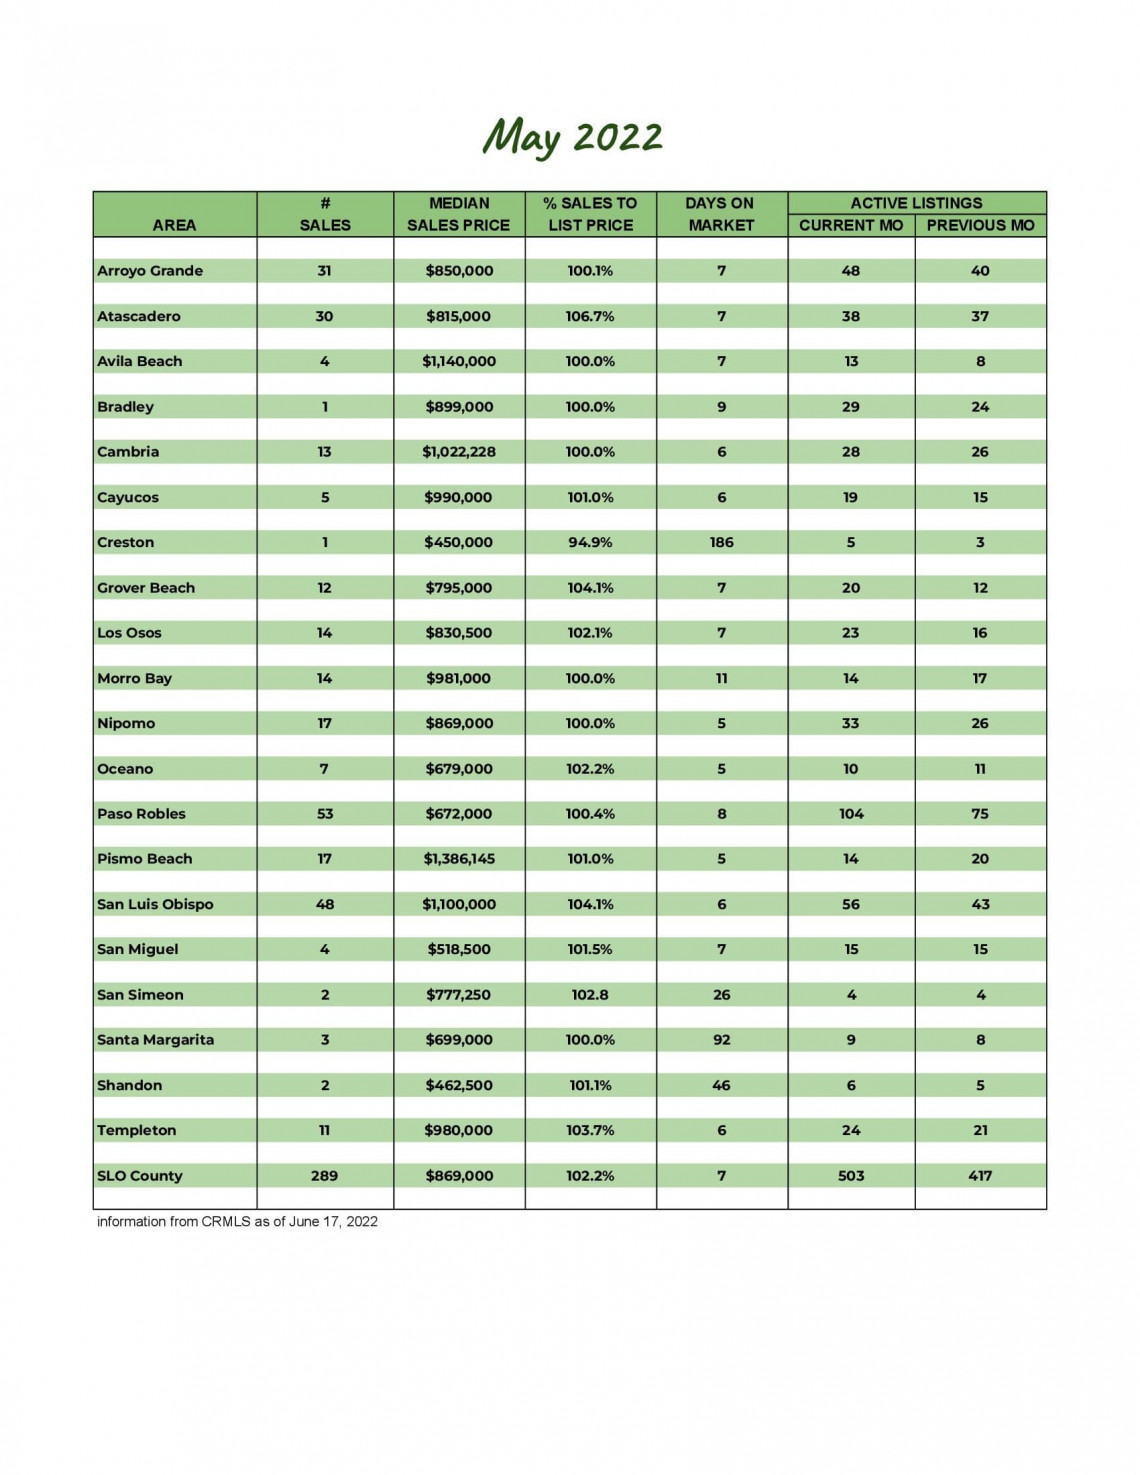
May 2022
The current real estate market is a hot topic! Interest rates and inventory have been driving factors, as the rates rise and the market stabilizes, inventory is also seeing a rise. While 503 active listings on the market has increased by almost 100 homes since last month, it is still well less than half of the 2019 inventory of 1304 homes.
Whether you have been thinking about buying or selling a home, it's important to have a good understanding of what’s going on in the San Luis Obispo County market.
Knowing the most important data such as the average sales price, the number of homes sold, and days on market will better prepare you to buy or sell a home.
Our market report showcases everything you need to know about the local real estate trends.
New Listings
Active Listings
Under Contract
Closed Sales
Average Sales Price
Average Days on Market
Average Price Per Square Foot
Months of Supply