San Luis Obispo County November 2024 Market Update
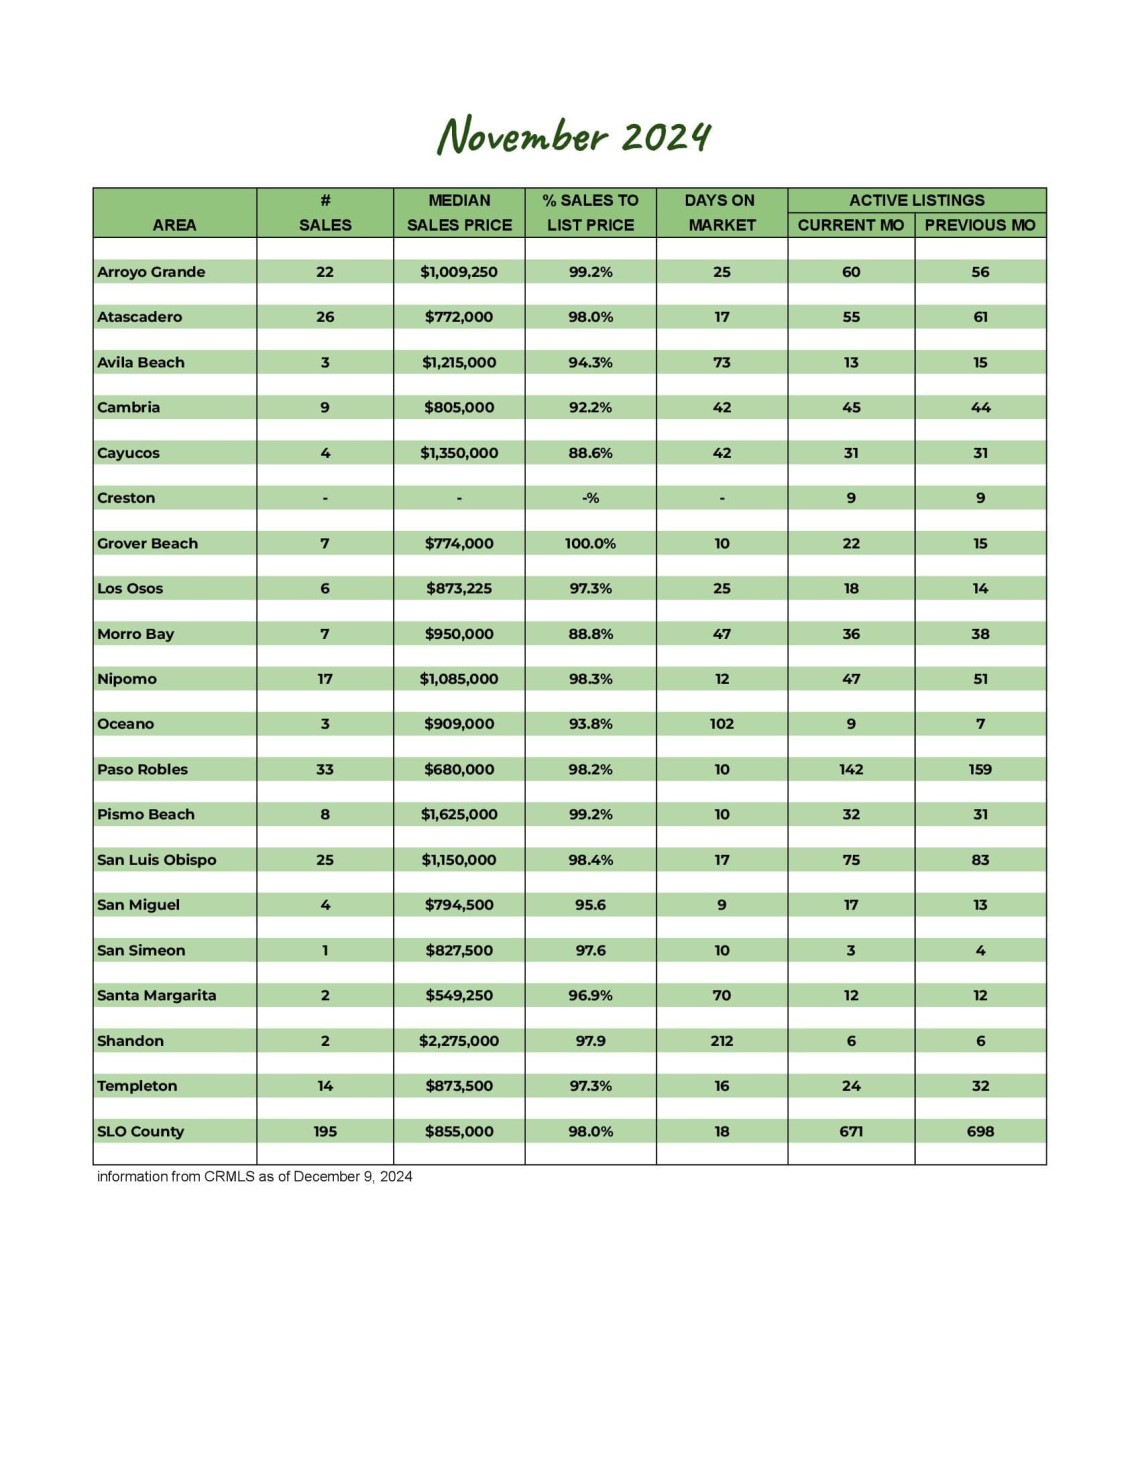
Whether you're considering buying or selling a home or simply staying informed about the local real estate scene, having access to the latest data is crucial. Our San Luis Obispo County market report provides a comprehensive look at current trends, helping you make well-informed decisions.
Pending sales dipped a moderate 8.3% from the same period last year and a more significant 49.3% from last month as interest rates bounced back to over 7%. Closed sales were down 26.7% from last month's spike while exceeding November 2023 numbers by 18.2%. And yet the current inventory is down a bit from last month, partially due to the drop in new listings. While the number of new listings is the same as this time last year, it decreased 20.7% from last month as typical for the season.
The average sales price in San Luis Obispo County is up 1.4% from last year, in line with the average price per square foot, up 1.5%. The average percentage of the sales price to list price dipped to 96.7% and the median days on the market increased to eighteen.
Knowing the most important data such as the average sales price, number of homes sold, and days on market can significantly enhance your real estate strategy, whether you're buying or selling.
Our market report showcases everything you need to know about each San Luis Obispo County community's real estate trends.
203
New Listings
2023: 201
671
Active Listings
2023: 592
144
Under Contract
2023: 157
195
Closed Sales
2023: 165
Homes Sold
96.7%
Sale-to-List Price
2023: 97.8%
$1,022,989
Avg Sales Price
2023: $1,008,379
3.2
Months of Supply
2023: 2.6
41
Avg Days on Market
2023: 29
$552
Avg Price per Sq Foot
2023: $544


